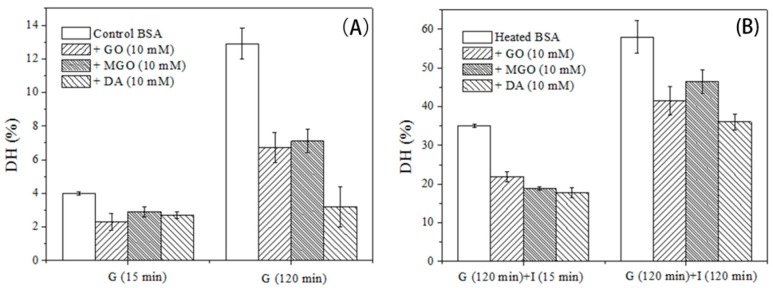
Figure 3.
DH of the control and glycated BSA during in vitro gastric (A) and subsequent intestinal (B) digestion. G (15 min) and G (120 min) refer to samples digested for 15 and 120 min in gastric stage, respectively. I (15 min) and I (120 min) represent samples digested for 15 and 120 min digestion in intestinal stage, respectively. Data are an average of triplicate data from two independent assays, and the error bars refer to standard deviations.

