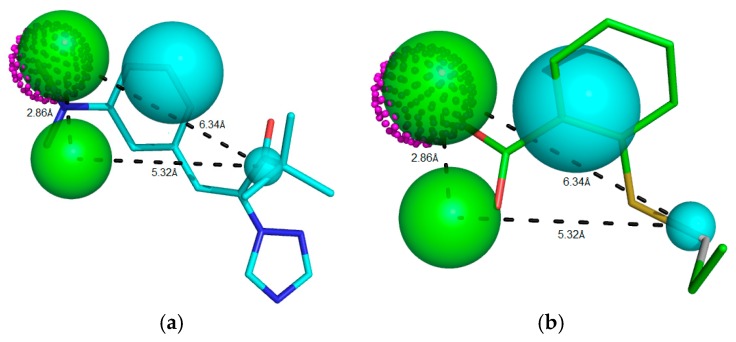
Figure 4.
Potent RIPK2 inhibitor (a) IC50 = 0.90 μM, Mol_qry value = 51.35; and (b) weak RIPK2 inhibitor IC50 = 1.40 μM, Mol_qry value = 04.10 superimposed to the pharmacophoric Model 05, where green beads/spheres represents Hbond acceptor groups, magenta doted sphere represents Hbond donor groups, while hydrophobic ones are shown in cyan spheres. The size of the beads varies according to the tolerance radius calculated using GALAHAD. All the distances are measured in angstroms.

