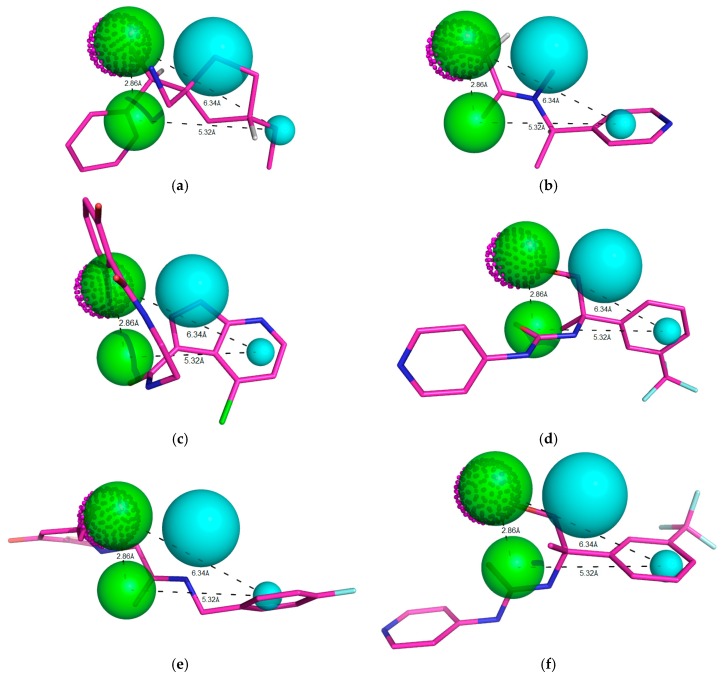
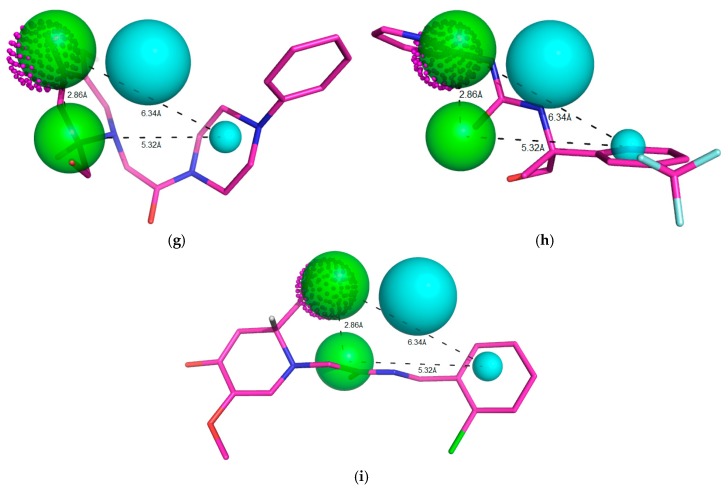
Figure 10.
Representation of the ten compounds that fit to the pharmacophoric model, with QFIT > 0. Green beads/spheres represent H-bond acceptor groups, magenta dotted spheres represent H-bond donor groups, while hydrophobic centers are shown in cyan spheres. Size of the beads varies according to the tolerance radius calculated using GALAHAD. All the distances are measured in angstroms (a) ZINC91881108; (b) ZINC81021663; (c) ZINC89571615; (d) ZINC69349687; (e) ZINC12230819; (f) ZINC69349685; (g) ZINC12230756; (h) ZINC69431616 and (i) ZINC12230826.


