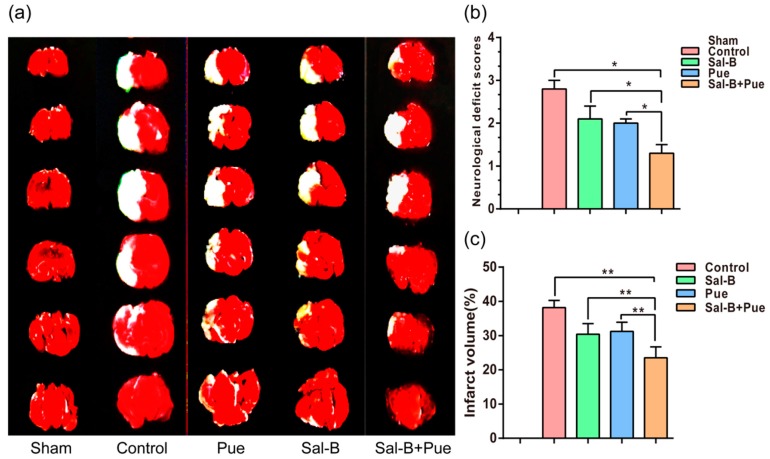
Figure 4.
(a) Effects of Sal-B, Pue, Sal-B + Pue on infarct volume and neurological functional outcome (n = 6). (TTC staining) White area indicates infarcted brain tissue; (b) Neurological deficit score; (c) Percentage of cerebral infarction volumes were calculated as described in “Methods.” The Sal-B + Pue group exhibited obviously less cerebral infraction (white area) compared with other groups. * p < 0.05; ** p < 0.01 vs. other group.

