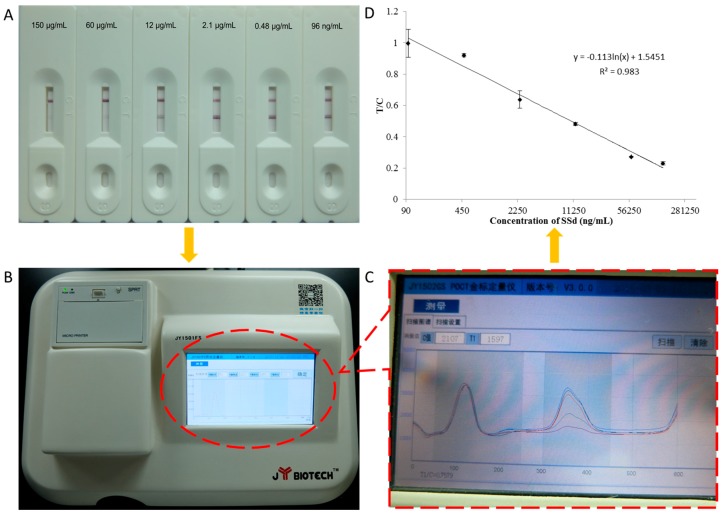
Figure 2.
Characterization of the lateral-flow immunoassay for SSd. (A) Photographs of results for standard solutions containing different concentrations of SSd assayed using the ICS; (B) Photograph of the matched colloidal gold scanned; (C) The intensity pattern of the test and control lines scanned by the colloidal gold quantitative instrument; (D) Standard curve of icELISA for SSd determination using the ICS. The regression equation is y = −0.113ln(x) + 1.5451, with a correlation coefficient (R2) of 0.983.

