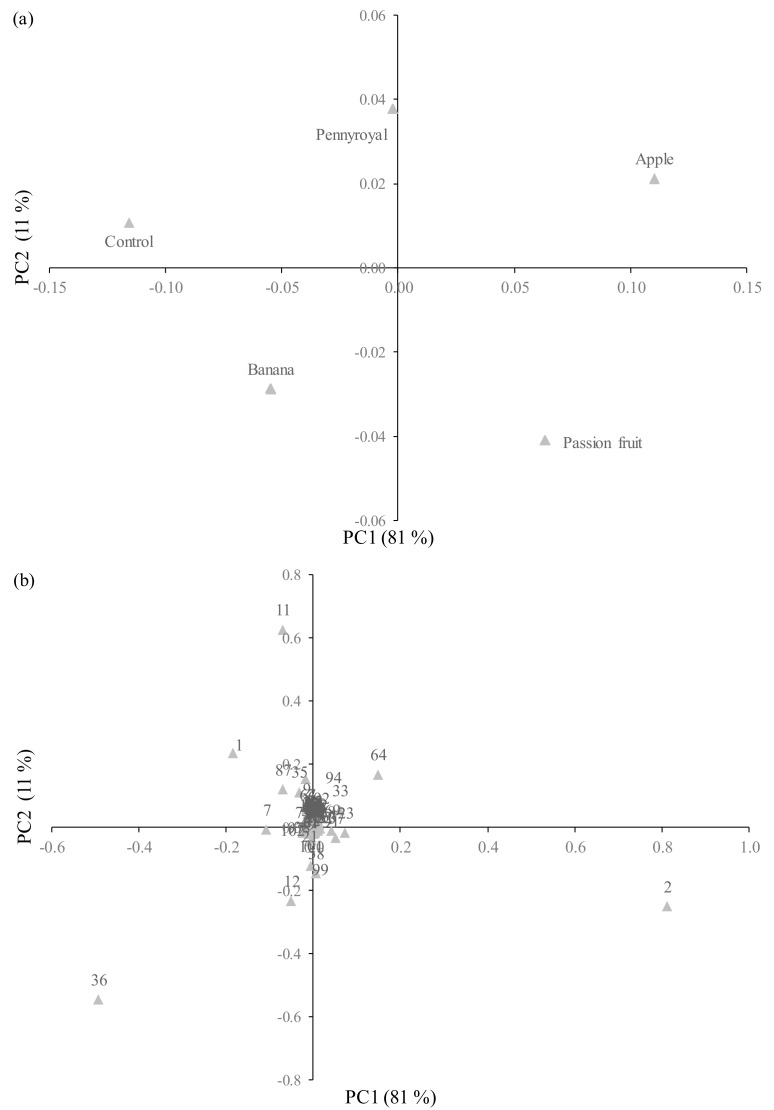
Figure 4.
(a) Principal components (PC) PC1 × PC2 of scores scatter plot of wine (control) and WBAV vinegars; (b) Loading plot of the main source of variability between volatile profile and wine vinegars—derived products by maceration with fruits and plant (attribution of the peak number shown in Table 1).

