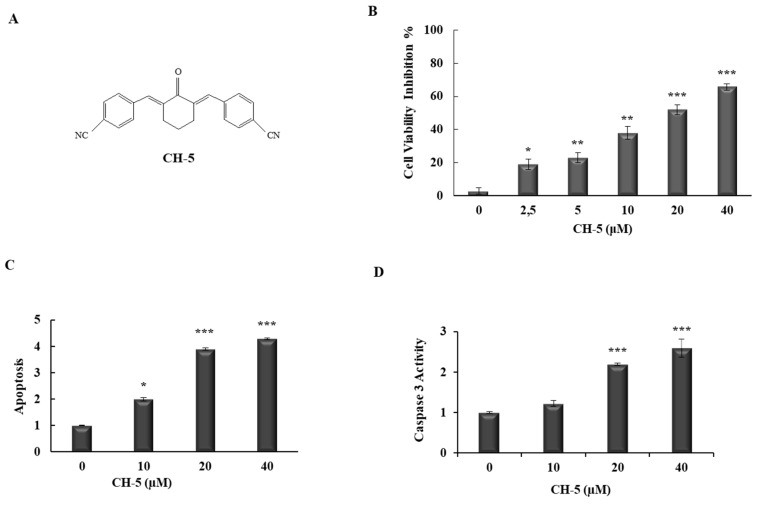
Figure 1.
Cellular viability of HGC-27 cells treated with CH-5. (A) Chemical structure of CH-5; (B) HGC-27 cells were treated with DMSO (0.1%) or with 0, 2.5, 5, 10, 20, 40 µM of CH-5, and after 24 h their viability was measured by an MTT assay. Each experiment was performed in quadruplicate; (C) Apoptosis induction by CH-5. HGC-27 cells were treated with DMSO (0.1%), or 10, 20, and 50 µM of CH-5, and after 24 h the rate of apoptotic cells was assessed by double staining (Annexin V-FITC/PI) flow cytometry assay. Y-axis represents fold induction compared to DMSO-treated cells; (D) Apoptosis was further confirmed by measuring caspase 3 activity in HGC-27 cells treated with CH-5. After treatment with CH-5 at the indicated concentrations, protein lysates were mixed with caspase-3 substrate, and then caspase-3 activity was determined by measuring absorbance, according to the manufacturer’s instructions described in the materials and methods section. Y-axis represents relative caspase activity compared to DMSO-treated cells. In all experiments, the data represent the mean ± SD of three experiments. * p ≤ 0.05, ** p ≤ 0.01, and *** p ≤ 0.001 compared with DMSO control.

