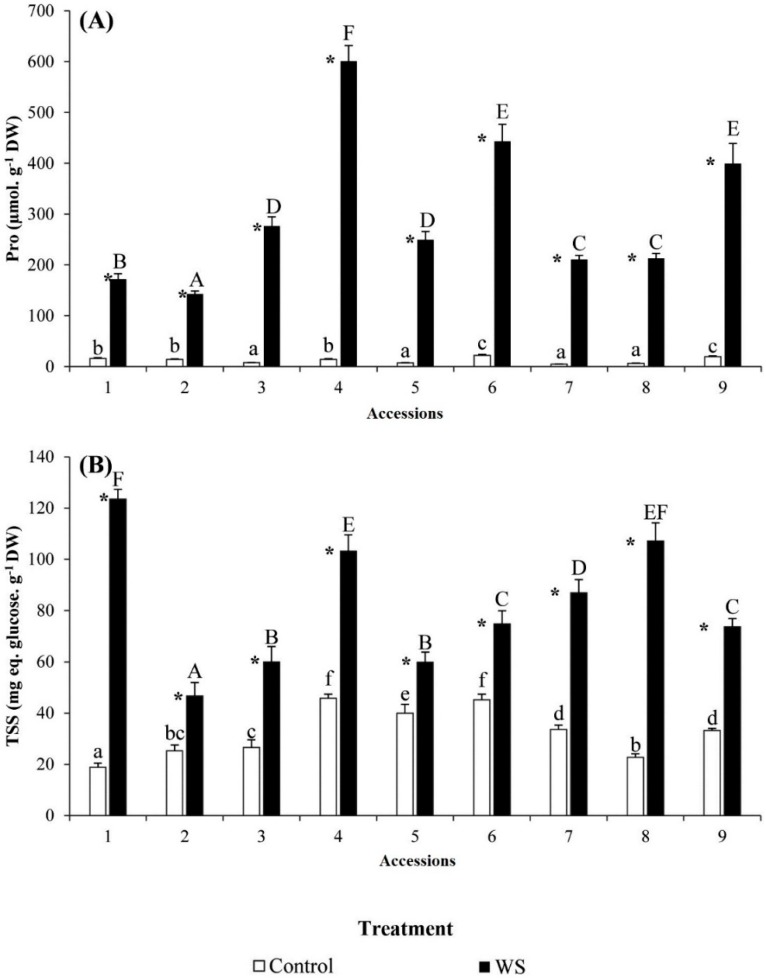
Figure 3.
Variation in osmolytes concentrations in the nine accessions of “Ardhaoui” barley landraces after three weeks of water stress (WS) treatment: (A) proline (Pro); and (B) total soluble sugars (TSS). Error bars indicate SE (n = 5). For each accession, asterisks (*) indicate significant differences between control and WS treatments and different letters indicate significant differences among accessions undergoing the same treatment, according to the Tukey test (α = 0.05).

