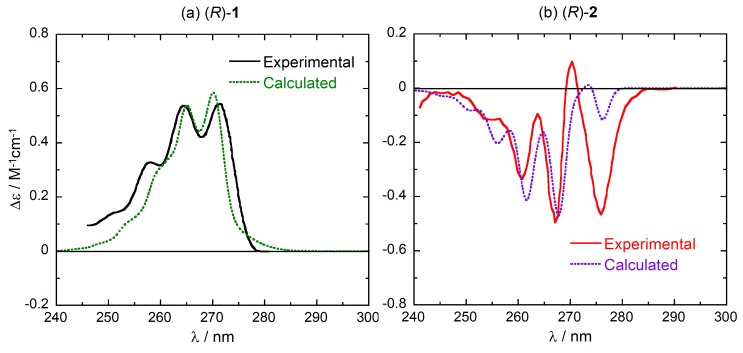
Figure 4.
Comparison between the experimental and weighted-average calculated vibronic ECD spectra of (R)-1 (panel a) and (R)-2 (panel b) in the 1Lb region. Calculated spectra plotted as sums of Gaussians with 0.025 eV exponential band-width, shifted by +30 nm and scaled by a factor 5 for better comparison. Experimental spectra reproduced from Ref. [28] with permission of Taylor & Francis Ltd., www.tandfonline.com.

