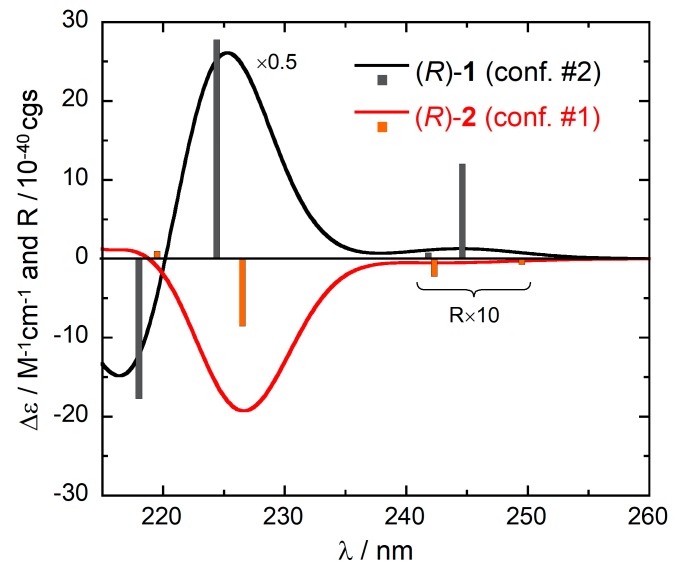
Figure 6.
Comparison between the and calculated ECD spectra of (R)-1 (conformer #2) and (R)-2 (conformer #1). Plotting parameters as in Figure 2. The vertical bars represent the calculated rotational strengths R, in 10−40 cgs units (scaled by a factor 2.5 to fit the vertical axis).

