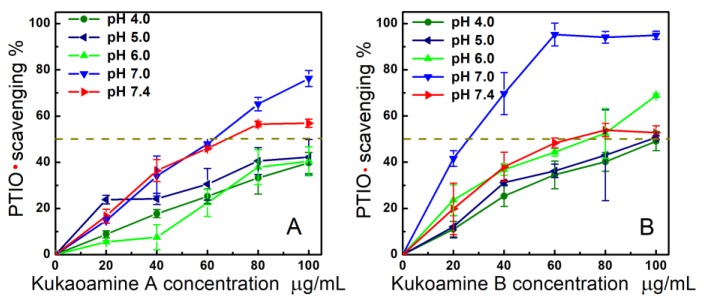
Figure 3.
Concentration-response curves for kukoamine A (A) and kukoamine B (B) in PTIO• scavenging at various pH values (pH 4.0, 5.0, 6.0, 7.0, and 7.4) (Trolox concentration response was measured only at pH 7.4 as a positive control. The concentration-response curves of Trolox are shown in Supplementary 1. Each value is expressed as the mean ± SD, n = 3; The IC50 values were detailed in Table 1).

