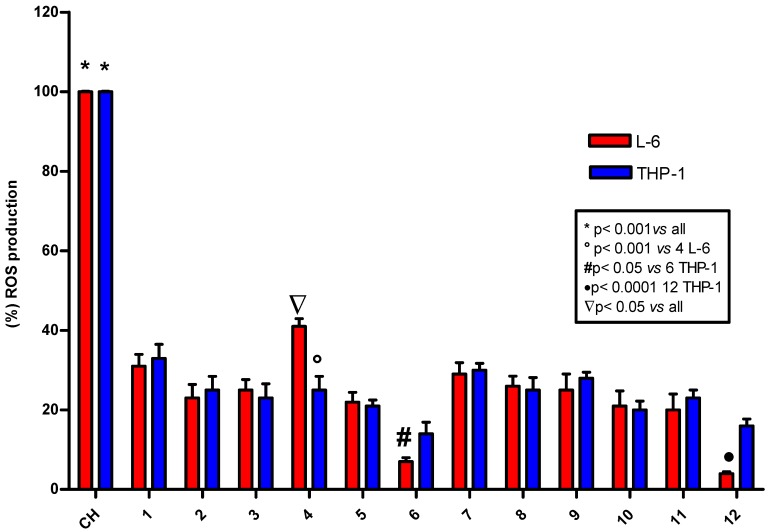
Figure 3.
Determination of intracellular ROS in L6 and THP-1 cell lines after stimulation of DCF fluorescence with 200 µM cumene hydroperoxide (CH) alone or in presence of phenethyl alcohols 1–6 or the corresponding trifluoroacetate esters 7–12 at 10 µM concentration. Data are reported as mean values ± SD of five experiments carried out in triplicate. Statistical analysis performed with one-way ANOVA and Bonferroni post-test, except for 4, 6, and 12 where Student’s t test was used.

