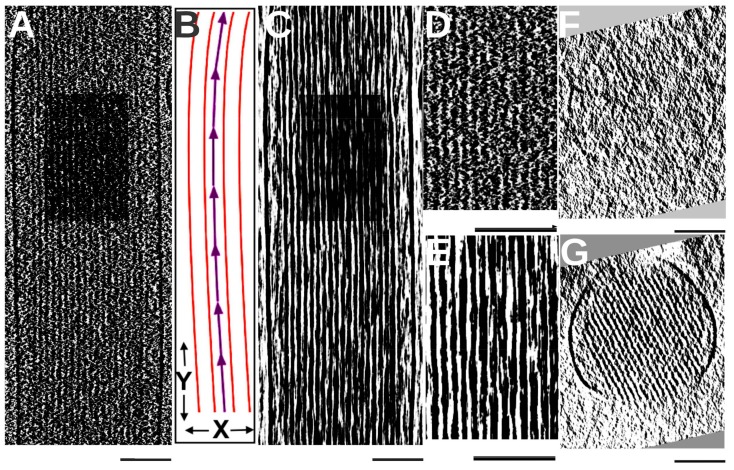
Figure 2.
Longitudinal averaging along the direction of the bundle. (A) A slab of the stereocilium map ~8 nm thick; (B) An illustration of the bundle direction (purple) calculated using 2D cross-correlation of cross-sections; (C) An ~8-nm slab of the longitudinally averaged map at the same position as in (A); (D,E) Zoomed-in views of (A,B), respectively, in the same sub-region (dark box in (A,B)); (F) A ~1-nm cross-section of the original map (G) The ~1-nm cross-section of the longitudinally-averaged map at the same position as in (F). Note that the cross-sectional view of the averaged map has high clarity; all scale bars represent 100 nm.

