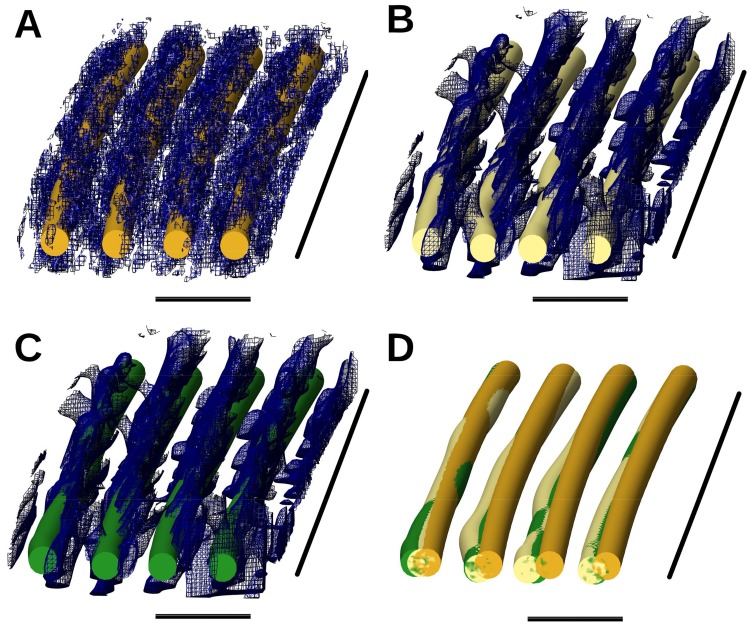
Figure 6.
A local view of filaments that were built after applying a polynomial regression for denoising. (A) Filaments built manually (gold) overlaid with the original map; (B) filaments built using one-peak convolution (khaki) overlaid with the denoised density map created using a polynomial regression; (C) filaments built using the seven-peak convolution (green) overlaid with the denoised density map created using a polynomial regression; (D) superposition of the three sets of filaments in (A–C). For (A–D), the horizontal scale bar is 20 nm, and the vertical scale bar is 630 nm.

