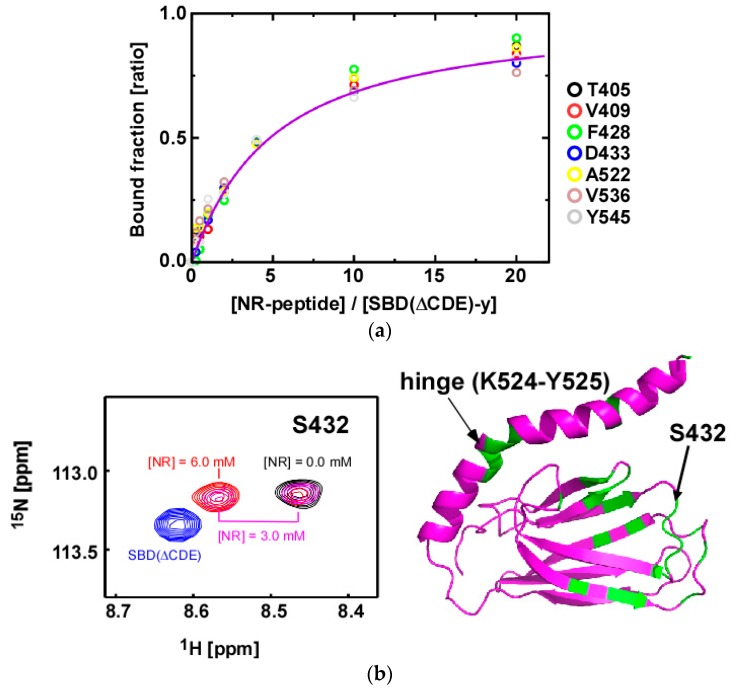
Figure 5.
NR-peptide binding to SBD(∆CDE)-y of human Hsp70. (a) Determination of the binding affinity of the NR-peptide to SBD(∆CDE)-y by measuring NMR signal intensity changes in 2D 1H-15N HSQC spectra for the listed residues examined in the NR-peptide titration. Global fitting the bound fractions of the listed residues gave a KD = 1.3 ± 0.1 mM; (b) A representative change in resonance intensities observed during the NR-peptide titration with SBD(∆CDE)-y. Data for S432 is shown (left). When the NR-peptide concentration ([NR]) is 3.0 mM and 0.3 mM SBD(∆CDE)-y is present there are signals observed for both the bound and free states (magenta). At [NR] = 6.0 mM, only the bound state signal for S432 is observed (red). For comparison, the 2D 1H-15N HSQC signal for S432 in SBD(∆CDE) (intramolecular αB bound form) is shown in blue. Residues showing significant spectral changes observed at [NR] = 1.2 mM are mapped onto the solution structure of SBD(∆CDE)-y (right).

