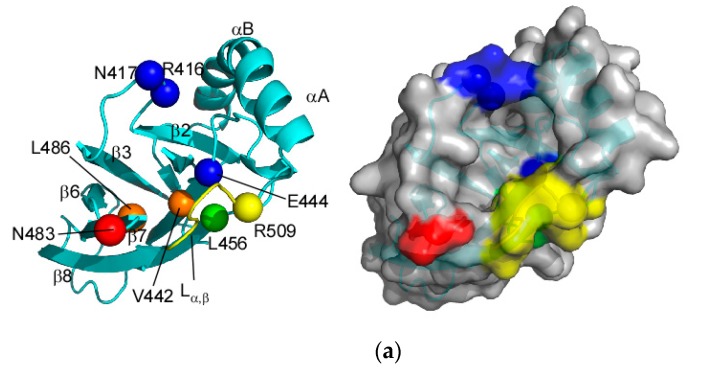
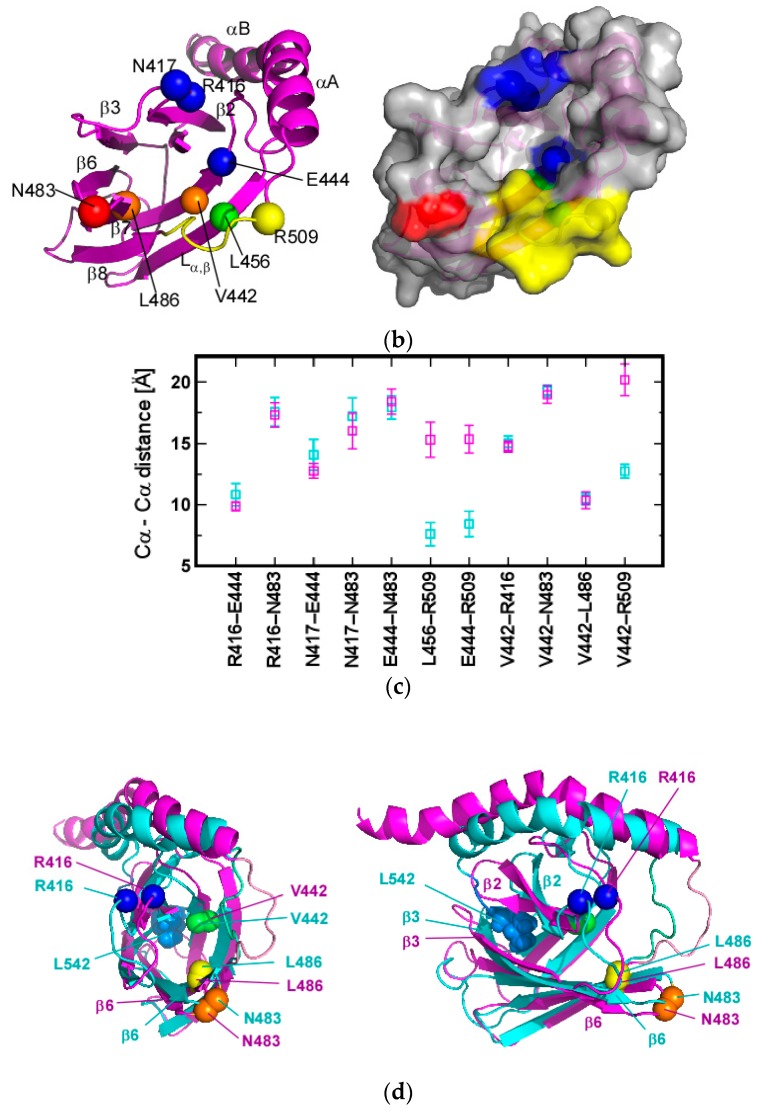
Figure 7.
Structural changes to residues located at the interdomain interface. (a) The Cα positions of residues engaged in the interaction with NBD: the Cα atoms for the annotated residues are shown by spheres on the structure of SBD(∆CDE) (left). A surface plot of the structure is shown in the left panel (right); (b) The corresponding residues marked in SBD(∆CDE) are shown in the structure of SBD(∆CDE)-y (left) with its surface plot (right); (c) Cα distance distributions for pairs of residues among the NMR ensemble of SBD(∆CDE) (cyan) and SBD(∆CDE)-y (magenta); (d) Structural comparison between SBD(∆CDE) (cyan) and SBD(∆CDE)-y (magenta) demonstrates the Cα position changes for pivotal residues engaged in interdomain interactions.


