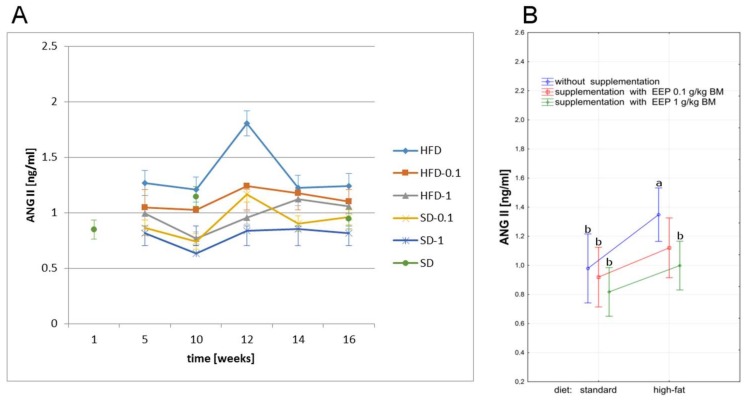
Figure 7.
Angiotensin II level in C57BL6 mice. (A) ANG II level in particular weeks of the study; (B) Average ANG II level (n = 10). HFD—high-fat diet; HFD-0.1—high-fat diet supplemented with EEP 0.1 g/kg BM; HFD-1—high-fat diet supplemented with EEP 1 g/kg BM; SD-0.1—standard diet supplemented with EEP 0.1 g/kg BM; SD-1—standard diet supplemented with EEP 1 g/kg BM; SD—standard diet. The highest ANG II concentration was recorded in HFD. In HFD-1 group, during the total period of observation, lower ANG II concentration was recorded when compared to HFD group; (p < 0.05; LSD ANOVA test; a—significant difference vs. SD, b—significant difference vs. HFD).

