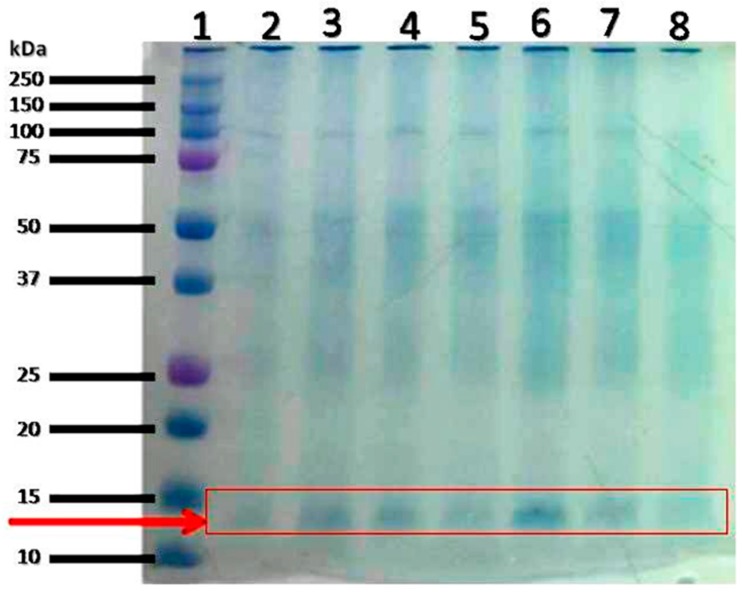
Figure 1.
1D SDS-PAGE gel from the liver of the experimental animals. Proteins (20 μg) were separated by 1D SDS-PAGE and visualized by CBB staining. The protein profiles of four representative samples are shown in this figure. Lane 1: Molecular marker; lane 2: STZ PI 200; lane 4: STZ; lane 6: Control and lane 8: STZ PI 400.

