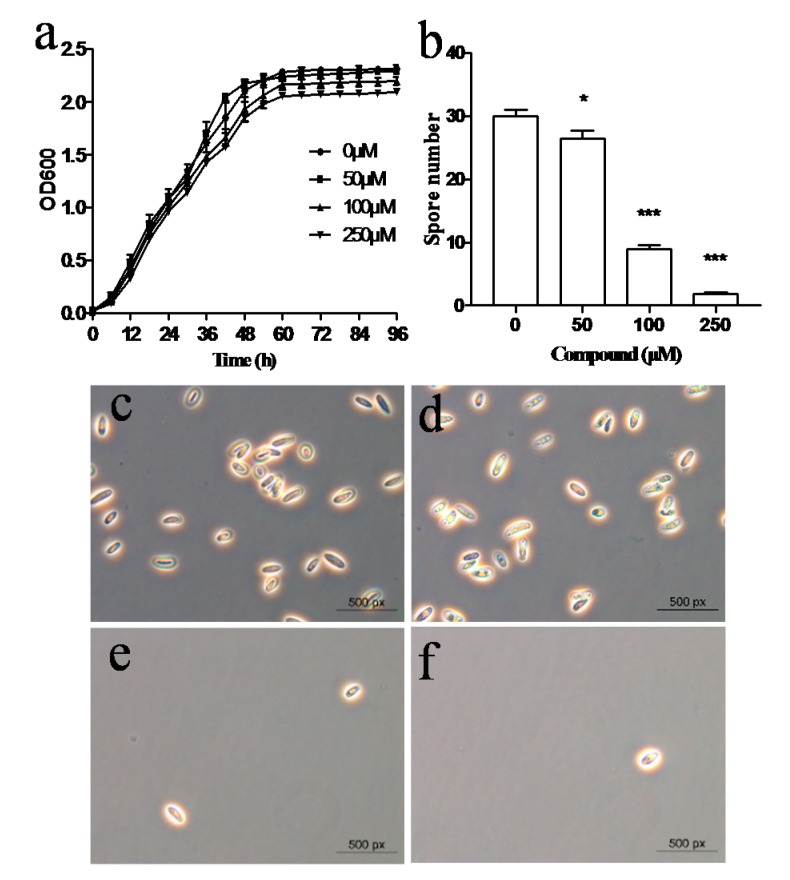
Figure 7.
Effect of cyclo(l-Pro-l-Phe) on the spore formation of M. grisea. Growth curve (a) and spore formation (b) of M. grisea in the presence of different final concentrations of cyclo(l-Pro-l-Phe) as indicated. Microscopic analysis of spore formation of M. grisea with addition of cyclo(l-Pro-l-Phe) at a final concentration of 0 (c); 50 μM (d); 100 μM (e); and 250 μM (f). Data are means ± standard deviations from three independent experiments. * p < 0.05; *** p < 0.001 (unpaired t-test).

