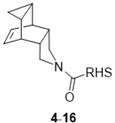
Table 2.
Novel 11β-HSD1 inhibitors featuring the 4-azapentacyclo[5.3.2.02,6.08,10]dodec-11-ene polycycle a,b.
 | ||||||
|---|---|---|---|---|---|---|
| Cp | RHS | hHSD1 % inh at 10 µM b | hHSD1 IC50 (µM) | HEK hHSD1 % inh at 10 µM c | HEK hHSD2 % inh at 10 µM c | HLM % Parent d |
| 2 |  |
100 | 0.019 | 100 | 69 | 27 |
| 4 |  |
100 | 0.546 | 77 | 84 | 85 |
| 5 |  |
100 | 4.265 | ND | ND | ND |
| 6 |  |
100 | 0.666 | 41 | 71 | 60 |
| 7 |  |
49 | ND | ND | ND | ND |
| 8 |  |
100 | 0.045 | 100 | 86 | 13 |
| 9 |  |
100 | 0.056 | 100 | 87 | 44 |
| 10 |  |
0 | ND | ND | ND | ND |
| 11 |  |
23 | ND | ND | ND | ND |
| 12 |  |
3 | ND | ND | ND | ND |
| 13 |  |
0 | ND | ND | ND | ND |
| 14 |  |
100 | 5.441 | ND | ND | ND |
| 15 |  |
100 | 11.560 | ND | ND | ND |
| 16 |  |
100 | 0.377 | 100 | 53 | 13 |
a See Experimental section for further details; b Percentage inhibition was determined relative to a no inhibitor control; c HEK293 cells stably transfected with the full-length gene coding for human either 11β-HSD1 or 11β-HSD2 were used; d Percentage of remaining compound after 30-min incubation period in HLM. ND, not determined.
