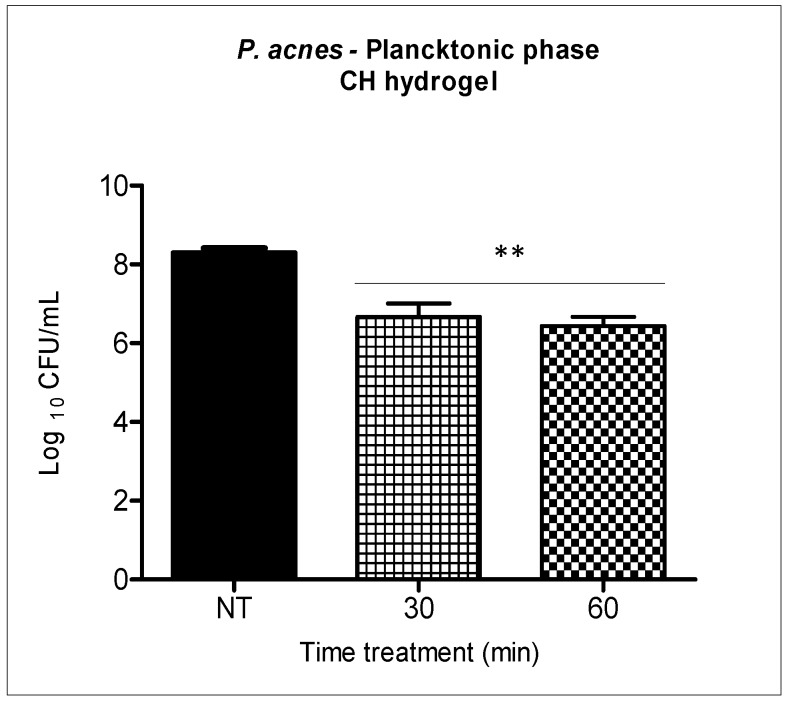
Figure 4.
Bacterial suspension incubated with the chitosan hydrogel at 0.25% for thirty and sixty minutes. Columns represent the average of three independent assays and bars represent the standard deviation. The asterisks indicatewhere there is a significant difference in comparison with the groups treated and the group no treated (NT) (one-way ANOVA with Tukey’s post-hoc). ** p < 0.01.

