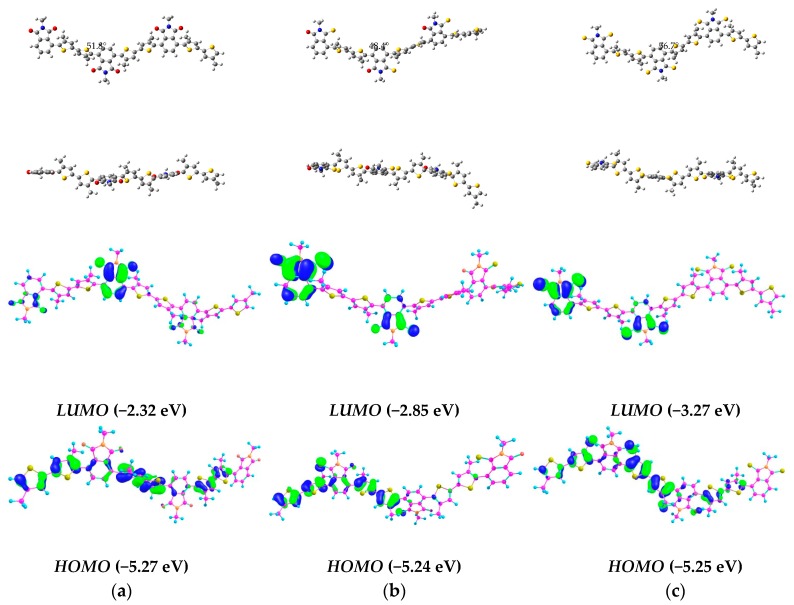
Figure 1.
Optimized molecular geometry and the frontier orbital density distributions for P1 (a); P2 (b) and P3 (c) via DFT calculations (B3LYP/6-31G (d, p)). Dihedral angels between adjacent rings (degrees, °) were shown in black text (top structures). HOMO and LUMO molecular orbital diagrams were shown below with calculated energy levels.

