Figure 1.
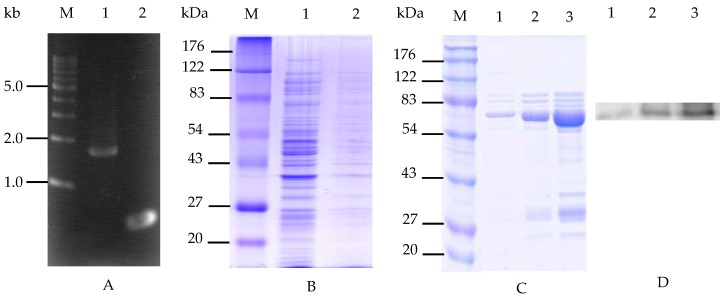
Targeted gene insertion and expression in E. coli. (A) The gel electrophoresis of amplified PCR cellulose products from B. licheniformis ATCC 14580 (lane 1) and INP from P. syringae KCTC 1832 (lane 2). M: 1 kb DNA marker; (B) SDS-PAGE analysis of the recombinant cells; M: standard protein size marker (molecular biomasses in kilodaltons), lane 1: the supernatant fraction of recombinant cell culture medium, lane 2: the total cell lysates of recombinant cell; (C) The purified fusion proteins following Ni-nitrilotriacetic acid (NTA)-sepharose resin treatment; M: standard protein size marker (kDa), lane 1: imidazole concentration of 20 mM in the binding buffer, lane 2: imidazole concentration of 50 mM in the binding buffer, lane 3: imidazole concentration of 100 mM in the binding buffer; (D) Western blot analysis of the purified fusion protein from SDS-PAGE results probed with anti-His-tag antibody, respectively.

