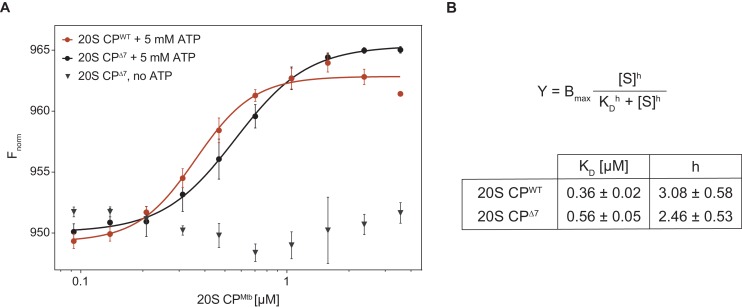
Figure 6. Microscale thermophoresis measurement of dissociation constant between RerCpa and Mtb20S CP.
(A) Binding curves of RerCpa vs. closed- (red) and open-gate (black) MtbCP in presence of ATP. The gray triangles represent a dataset recorded for Cpa and open-gate proteasome in absence of nucleotide. (B) Dissociation constants and Hill coefficients for the two measured datasets.

