. 2018 May 29;7:e34055. doi: 10.7554/eLife.34055

Figure 8. The cpa gene is co-transcribed together with neighboring psd and pssA genes.

(A) Organization of the cpa gene locus in Msm and design of probes used to test for gene co-transcription. (B) Visualization of all six probes amplified from cDNA produced from total RNA using a cpa-specific primer (middle of the gel). A set of reactions without reverse transcriptase was included to test for presence of contaminating genomic DNA (NTC – no template control; left part of the gel) as well as standard PCR with genomic DNA as a template to visualize the expected length of all probes (right part of the gel).

Figure 8.

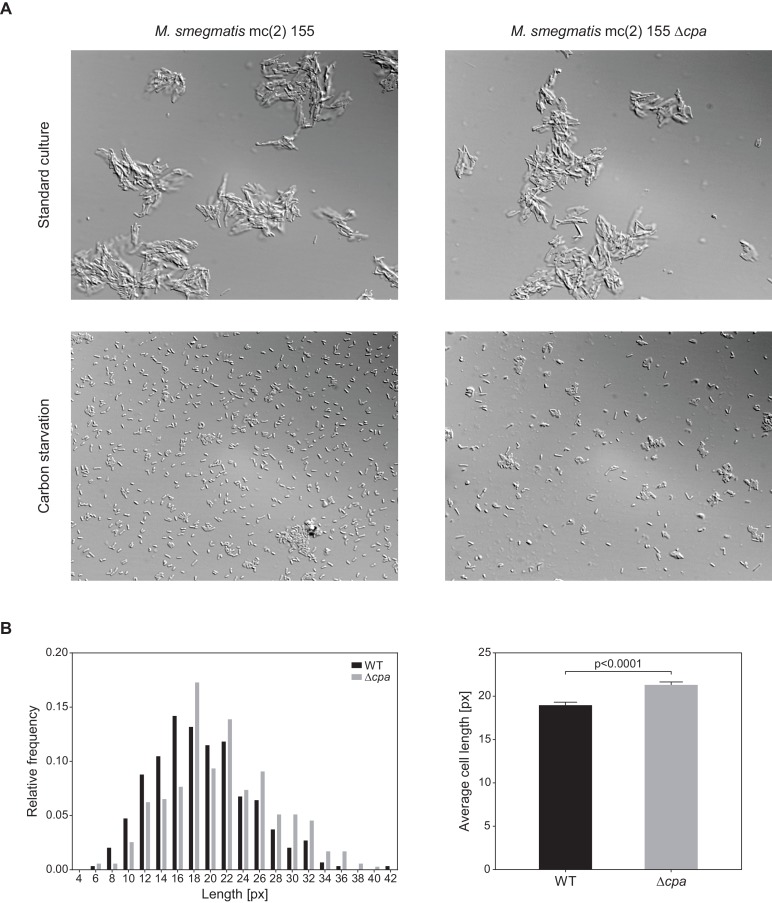
Figure 8—figure supplement 1. M. smegmatis cells lacking cpa do not exhibit significant differences in size or shape to wild-type cells either under standard conditions or when grown in absence of glycerol.

Figure 8—figure supplement 1.

(A) Light microscopy images of M. smegmatis wild-type and ∆cpa cells during growth in presence (top) and absence (bottom) of glycerol as a main carbon source. (B) Statistical analysis of the average cell length during carbon starvation. A histogram depicting the distribution of cell length (in pixels) is shown on the left and the average cell length for both strains is shown on the right. The error bars represent standard error of the mean (SEM). The cell length difference is statistically significant at the p-value of 0.0001 (unpaired two-tailed t-test).