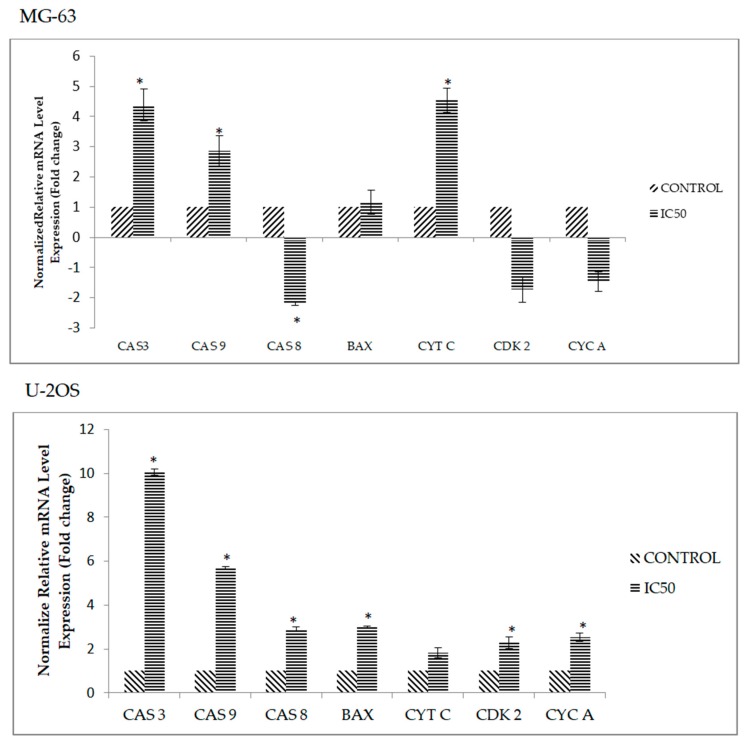
Figure 6.
qPCR analysis of apoptosis and cell cycle related genes; caspase 3 (CAS 3), caspase 8 (CAS 8) and caspase 9 (CAS 9), BAX, cytochrome c (CYT C), Cdk 2 (CDK 2), cyclin A (CYC A) for MG-63 and U-2OS when treated DK1 (IC50) for 48 h. Expressions of all target genes were normalized to ACTB and 18srRNA. All data are expressed as mean ± standard error mean (S.E.M). * p < 0.05 compared with corresponding controls. The significance for this assay was set at >2 fold changes, comparing between the control (untreated) group and the treated groups.

