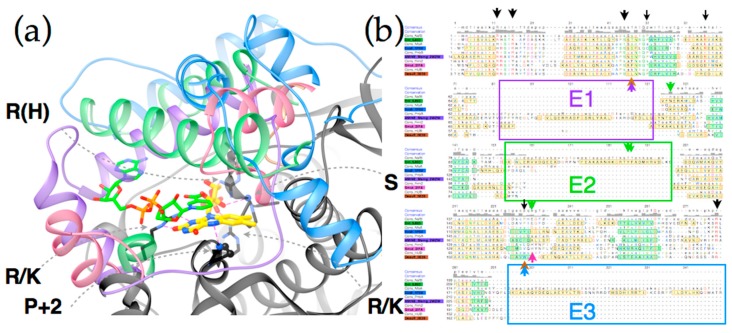
Figure 5.
Comparison of the different substrate binding cavities, and their different origins in the sequences of PnbA (purple), NfsB (green), NfsA (blue) and Frm2 (pink). Panel (a) shows the contrast between exposed flavin binding pocket provided by conserved core structure (black) vs. enclosed substrate binding cavities formed by the distinguishing structures of the different subgroups. A map of amino acid conservation onto backbone structure for each of the current five subgroups is provided as Supplementary Figure S8. Core structure interactions that appear to stabilize FMN binding are indicated by grey dashed arrows. R(H) means Arg but sometimes His, R/K means Arg or Lys, P + 2 means that the second residue after a Pro contributes the interaction, S means Ser. The FMN from NfsB is included in yellow and an NADH analog bound to the NfsB model is in green, both with non-C atoms coloured by atom [50]; (b) Shows an alignment of consensus and representative sequences from each of these subgroups and HUB (brown label). The three insertions/extension in the sequence giving rise to the distinguishing structure are in boxes colored according to the subgroup in which it is best developed and labeled ‘E1’, ‘E2’ and ‘E3’ as per Akiva, Copp et al [41]. Yellow shading denotes alpha helices and green denotes beta strands. Black arrows indicate the locations of core residues interacting with the FMN, and arrows colored according to the above subgroup identify residues mentioned in the text as possibly constraining substrate binding and/or modulating flavin activity. A larger multi-sequence alignment is provided as Supplemental Figure S9 and those of the subgroups are available via the Structure Function Linkage Database [48].

