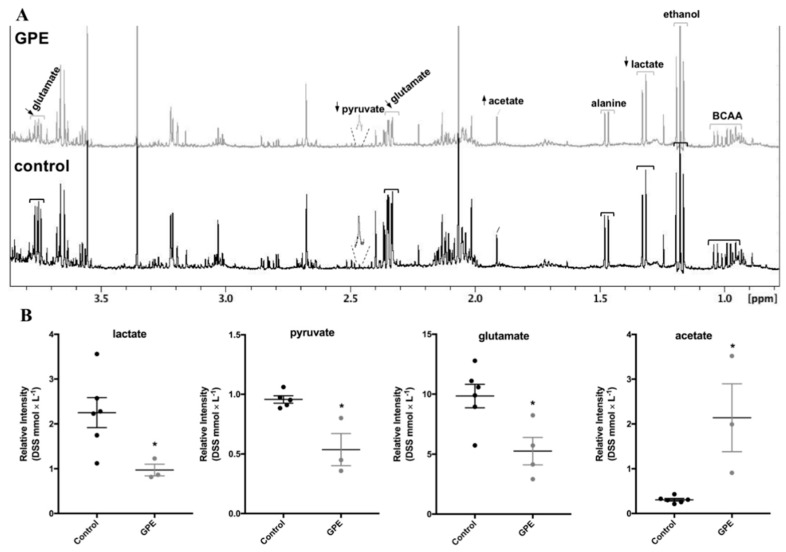
Figure 6.
GPE affected intracellular metabolites in HepG2 cells. HepG2 cells were treated for 1 h with 300 × mL−1 GPE after which intracellular metabolites were evaluated in a protein-free cellular extracts by one dimension 1H-NMR spectroscopy. (A) Representative 1H-NMR spectrum, showing the decrease μ(↓) or increase (↑) in metabolites content in GPE compared to control HepG2 cells; (B) Relative intensity of lactate, pyruvate, glutamate and acetate peaks in HepG2 cells. n = 4 independent experiments, * p < 0.05, compared to control cells. BCAA: branched-chain amino acids; ethanol used as vehicle.

