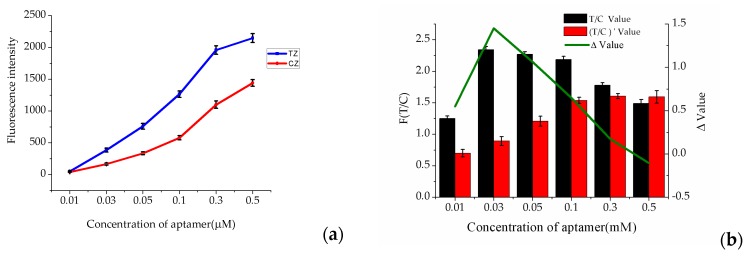
Figure 3.
Optimization of the aptamer concentration. (a) The trend of the fluorescence intensities (Test Zone (TZ) and Control Zone (CZ)) with the increase of the aptamer concentration; (b) The variation in the T/C value before (T/C Value) and after ((T/C)’ Value) the solution was spiked with 30 ng·mL−1 OTA (n = 3).

