
Figure 7.
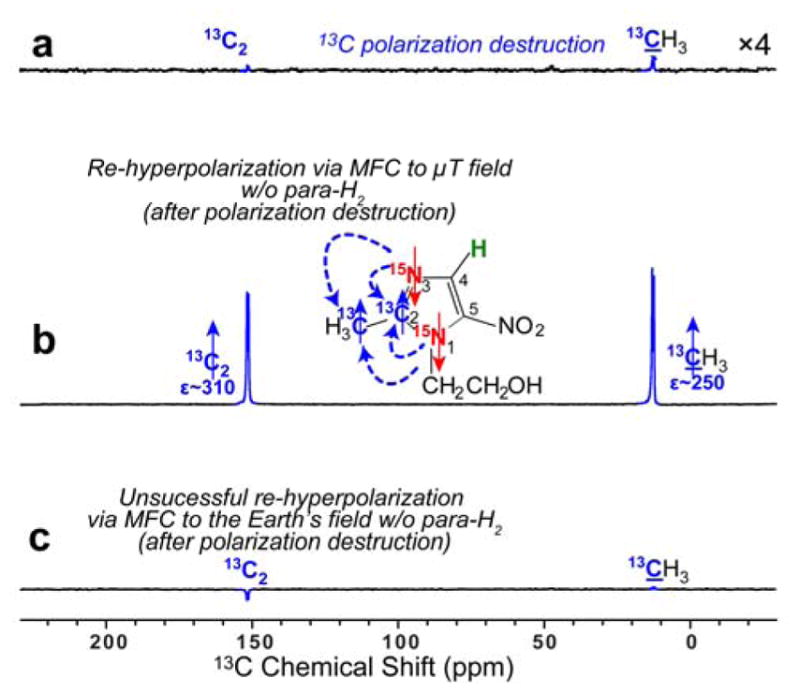
13C NMR spectra of HP metronidazole-15N2-13C2. a) Spectrum obtained After SABRE-SHEATH hyperpolarization at μT magnetic field, followed by cessation of para-H2 bubbling, and sample transfer to the 9.4 T NMR spectrometer, followed by 1H and 13C polarization destruction (via applying a series of 90° RF pulses to 13C spins and 1H decoupling to 1H spins); b) The spectrum obtained by the procedure described in (a) but followed by magnetic field cycling (MFC) to the μT regime (i.e. within a magnetic shield) and then after the sample was returned to the 9.4 T NMR spectrometer. c) The spectrum obtained by the procedure described in (a) but followed by magnetic field cycling (MFC) to the Earth’s magnetic field prior to return to the 9.4 T NMR spectrometer. All NMR spectra shown were acquired using a 90° excitation RF pulse after the respective manipulations described in the figure caption above.