
Fig. 2.
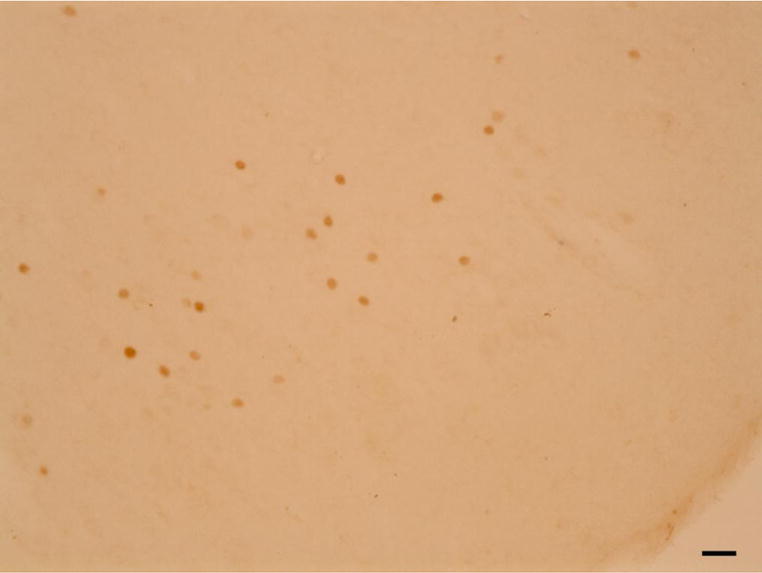
Photomicrograph of c-fos positive cells, as they could be observed during the quantitative analyses, using a 20 X objective (N.A. 0.5) on a Nikon Eclipse 80i microscope (Nikon Instruments, Melville, NY, USA) linked to PC-based StereoInvestigator 11.0 (MBF Bioscience, Williston, VT, USA). Scale bar: 25 μm.