
Fig. 3.
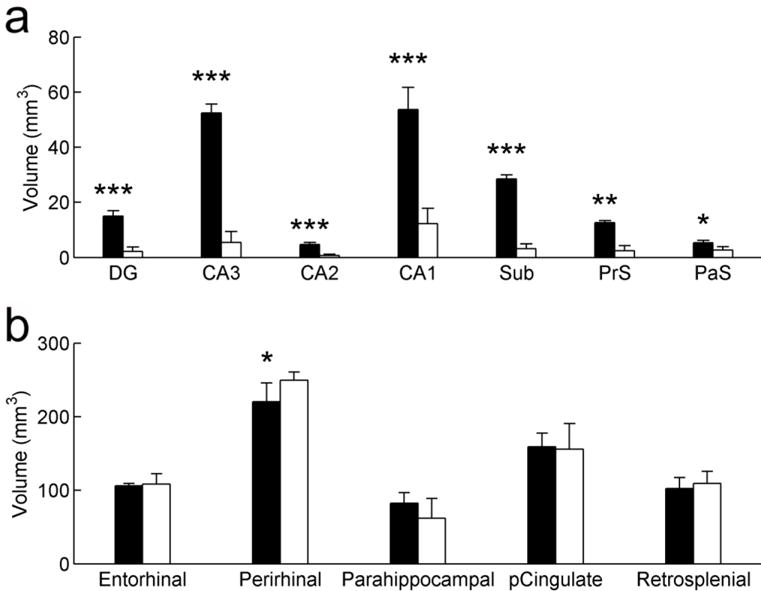
Volumes of the different regions of the hippocampal formation (a) and cortical areas (b) analyzed in the current study. Control monkeys in black; Hippocampal-lesioned monkeys in white. Average ± SD; *: P < 0.05; **: P < 0.01; ***: P < 0.001.
Official websites use .gov
A
.gov website belongs to an official
government organization in the United States.
Secure .gov websites use HTTPS
A lock (
) or https:// means you've safely
connected to the .gov website. Share sensitive
information only on official, secure websites.
Volumes of the different regions of the hippocampal formation (a) and cortical areas (b) analyzed in the current study. Control monkeys in black; Hippocampal-lesioned monkeys in white. Average ± SD; *: P < 0.05; **: P < 0.01; ***: P < 0.001.