
Fig. 4.
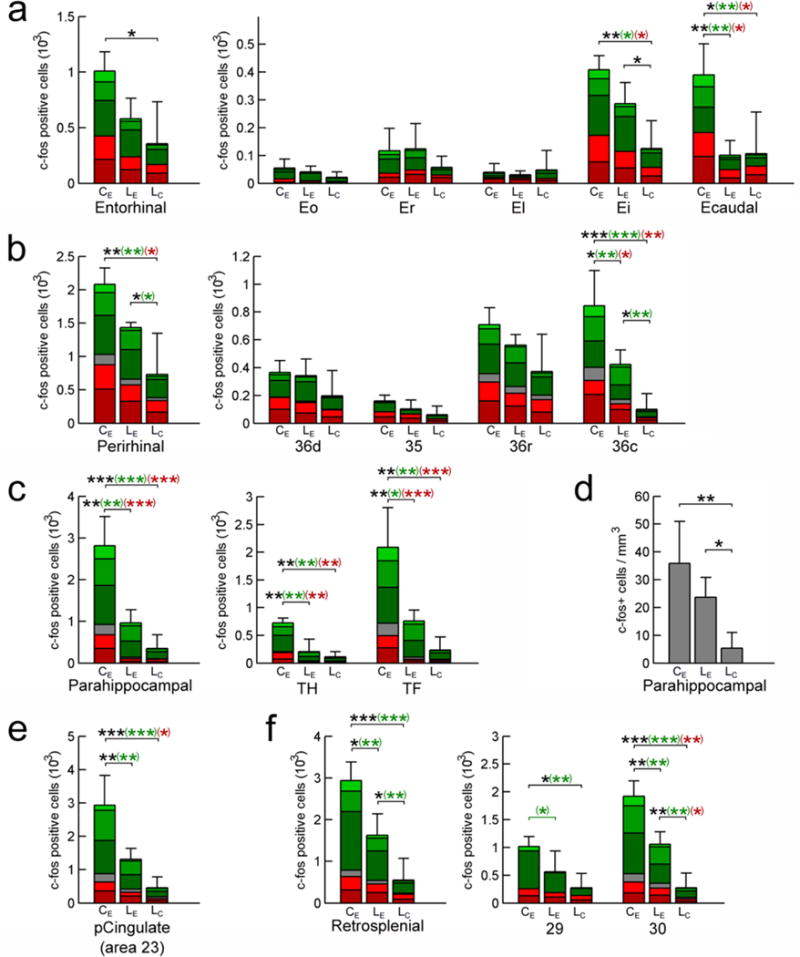
Number of c-fos positive cells: entorhinal cortex (a), perirhinal cortex (b), parahippocampal cortex (c), posterior cingulate cortex (e), and retrosplenial cortex (f). Panel (d): density of c-fos positive cells in the parahippocampal cortex (across regions and layers). ControlExplo (CE), LesionExplo (LE) and LesionCage (LC) monkeys. Stacked bars represent the number of c-fos positive cells in the six cortical layers (light green: layer I; green: layer II; dark green: layer III; gray: layer IV (not present in entorhinal cortex); light red: layer V; dark red: layer VI). Average ± SD; *: P < 0.05; **: P < 0.01; ***: P < 0.001; in black: all layers; in green: superficial layers (I, II, III); in red: deep layers (V, VI).