
Fig. 5.
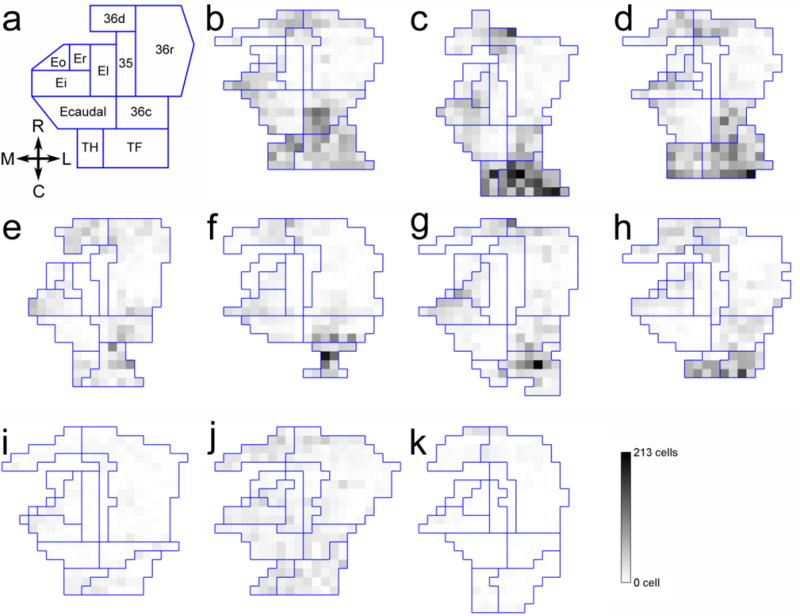
Two-dimensional unfolded map representations of the number of c-fos positive cells in the entorhinal cortex (areas Eo, Er, El, Ei, Ecaudal), perirhinal cortex (areas 35, 36d, 36r, 36c) and parahippocampal cortex (TH, TF). a: Unfolded map showing the different subdivisions considered in the study. b–d. ControlExplo monkeys. e–h: LesionExplo monkeys. i–k: LesionCage monkeys.