
Fig. 6.
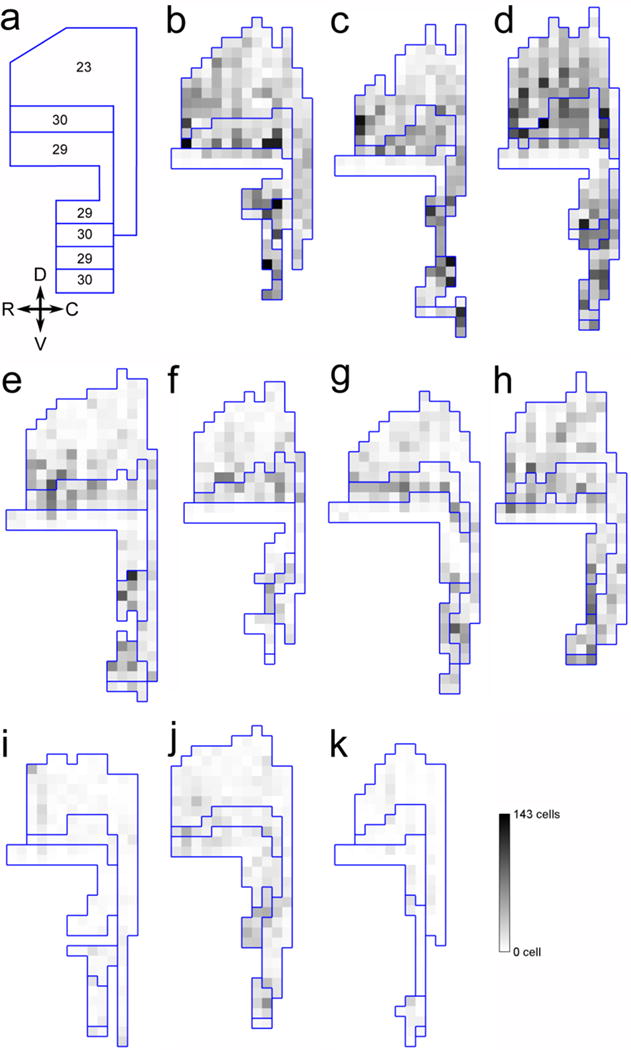
Two-dimensional unfolded map representations of the number of c-fos positive cells in the posterior cingulate cortex (area 23) and retrosplenial cortex (areas 29, 30). a: Unfolded map showing the different subdivisions considered in the study. b–d. ControlExplo monkeys. e–h: LesionExplo monkeys. i–k: LesionCage monkeys.