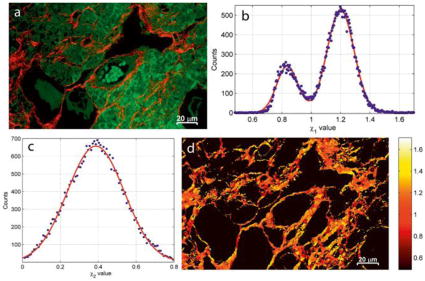
Figure 3.
a) The TPEF (green) identifies features in the mouse ovary tissue distinct from the SHG (red), which primarily shows the ordered collagen fiber regions. b) The parameter shows two populations of collagen-related signals in the SHG channel, which are attributed to the presence of collagen type I (χ1 = 1.2) and type III (χ1 = 0.83). c) The , only includes one broad population that does not provide additional contrast for the collagen fibers in the χ-image of the tissue. d) A pseudo-colored image of χ1. Reprinted with permission from ref [64], copyright 2015 John Wiley and Sons.

