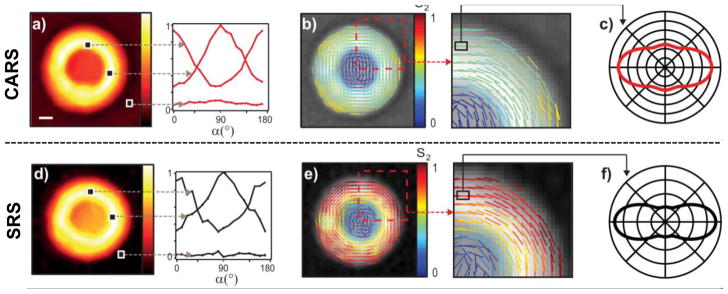
Figure 5.
A nonresonant contribution gives a non-zero background in CARS (a) that interferes with the vibrational signal from the MLV and causes an apparent broadening of the orientation distribution function as determined by the S2 parameter in the theoretical model (b and c). However, the background is low in SRS (d) and the corresponding model and parameter give a more definite and narrow distribution function of the molecular orientation for the CH2 groups in the MLV (e and f). The orientation of the lines denotes the average CH2 orientation obtained, while the color indicates the magnitude of the S2 parameter (b and e). Reprinted from ref. [79], copyright 2015 American Chemical Society.

