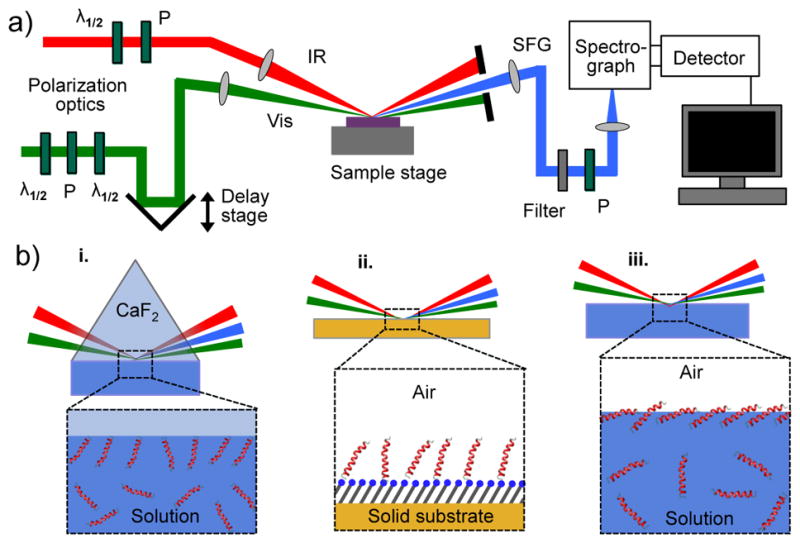
Figure 6.

a) A schematic of a typical setup for vibrational SFG spectroscopy in reflection mode. b) Illustrations of solid/liquid (i), solid/air (ii), and liquid/air (iii) interfaces, which are commonly analyzed with SFG. The interactions at the interface typically induce a preferential orientation of the analyte that can then be characterized with SFG, while the isotropically distributed species in bulk do not contribute to the signal.
