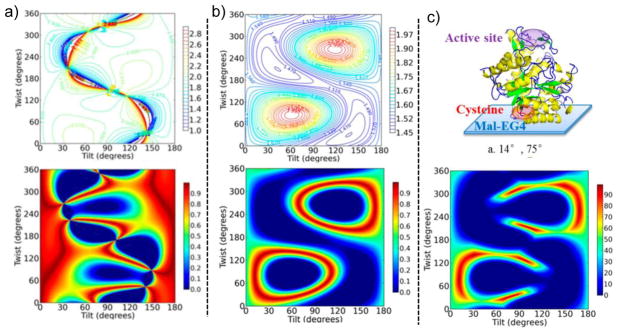
Figure 8.
a) Top: A color map of the ratio depending on the tilt and twist angles for an azimuthally isotropic distribution of the β-Gal enzyme with a V152C mutation. Bottom: Based on the measured ratio of 1.9, the orientation map has been color-coded 0 to 1 from worst to perfect fit with the top color map. b) The corresponding color maps for the ratio of s- and p-polarized ATR-FTIR measurements of the same interface. c) When combined, only a limited range of orientations give values that agree with both the SFG and ATR-FTIR data. The protein illustration shows one of the predicted orientations, given the data and the V152C mutation. Reprinted with permission from ref. [106], copyright 2013 American Chemical Society.

