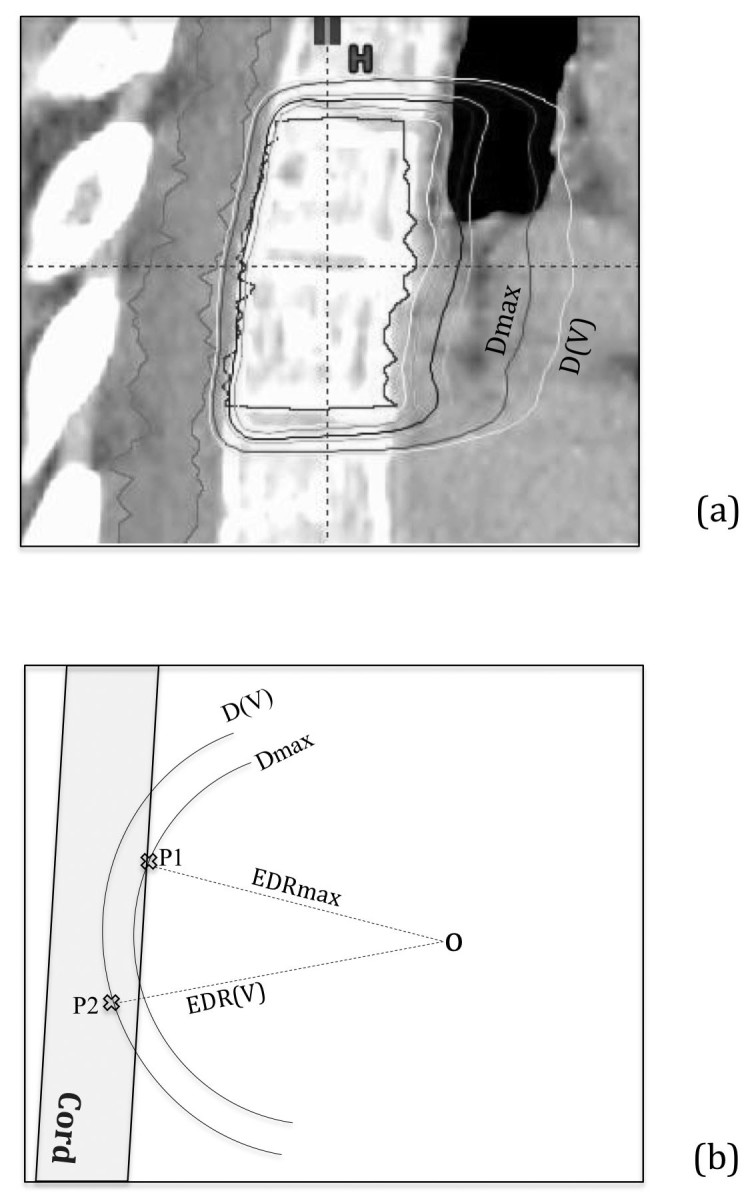
Figure 1.

Schematic illustration of the EDR definition: (a) shows a clinical case with the peripheral isodose surface corresponds to the spinal cord Dmax value and another corresponds to small-volume D(V) such as D(0.3 cc) etc. and (b) illustrates the corresponding EDR parameters including Dmax of the spinal cord for the case.
