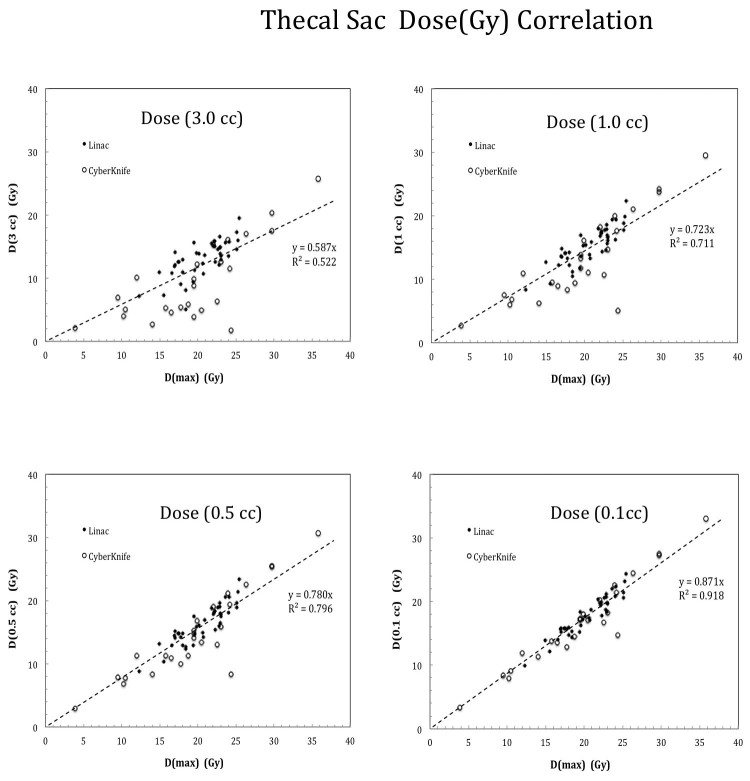
Figure 2.
Dose correlation results for the thecal sac at variable isodose volumes from 0.1 cc to 3.0 cc. Relatively strong correlation (R2=0.918) was observed for small isodose volume such as 0.1 cc due to the near-neighborhood effect while significantly weaker correlation was seen for large isodose volumes such as R2=0.522 at 3.0 cc instead.

