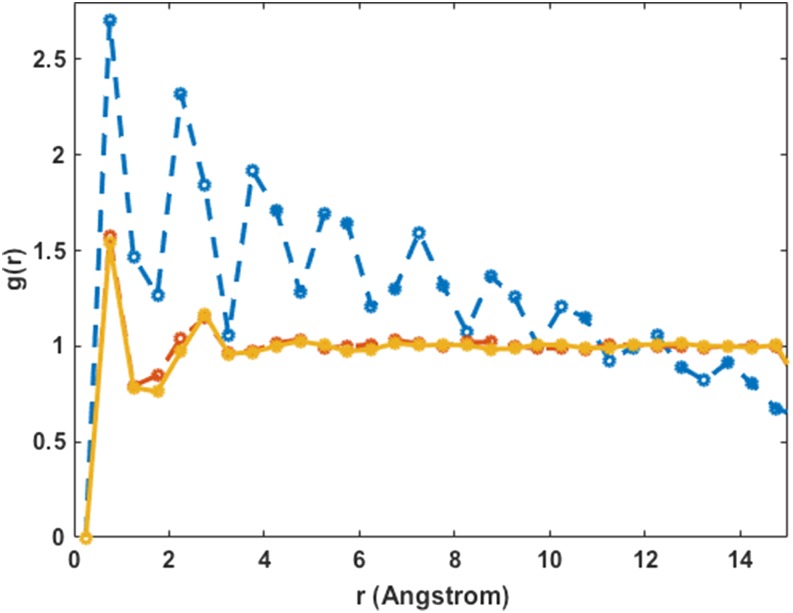
FIG. 6.
The pair correlation function of only the blue (type 2) particles is shown as a function of the number of MDAS steps for the system described in Fig. 5. At the beginning, the system is ordered and the pair correlation function (the blue dashed line) shows a series of long range peaks. After about 350 accepted MDAS steps (the dashed red line), the system converges to a typical liquid-like distribution with one dominant peak and a shallower secondary distance peak. The distribution after 750 accepted MDAS steps remains essentially unchanged (the yellow line).

