
FIGURE 1.
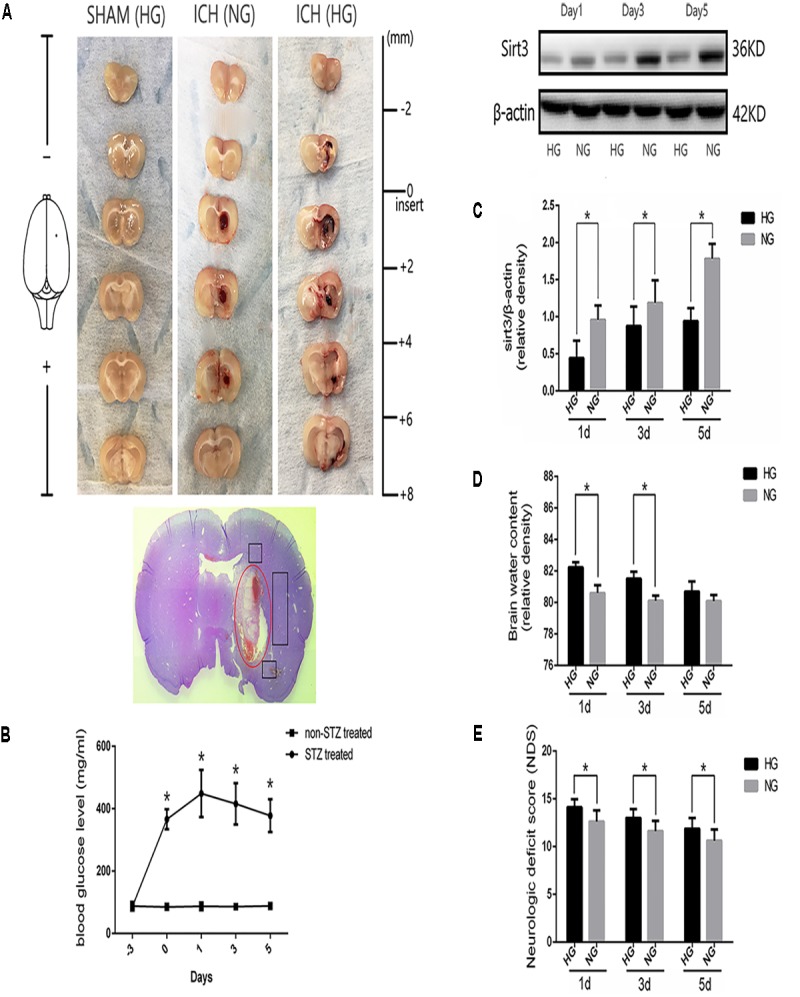
Hyperglycemia suppressed sirt3 expression and aggravated cerebral injury after ICH. (A) Representative images of brain sections in each group. HE staining of ICH and the bleeding site (red circle). (B) Glucose levels of streptozotocin (STZ) treated and non-STZ-treated rats before and after experimental intracerebral hemorrhage (ICH), ∗P < 0.05 versus non-STZ-treated group (n = 6 in each group). (C) Western blotting showed the sirt3 protein expression in HG and NG group on days 1, 3, and 5 after ICH, ∗P < 0.05 (n = 6 in each group). HG, high blood glucose; NG, normal blood glucose. (D) The comparison of brain water content in HG and NG group on days 1, 3, and 5 after ICH, ∗P < 0.05 (n = 6 in each group). (E) The comparison of neurologic deficit scores in HG and NG group on days 1, 3, and 5 after ICH, ∗P < 0.05 (n = 9 in each group).