
FIGURE 3.
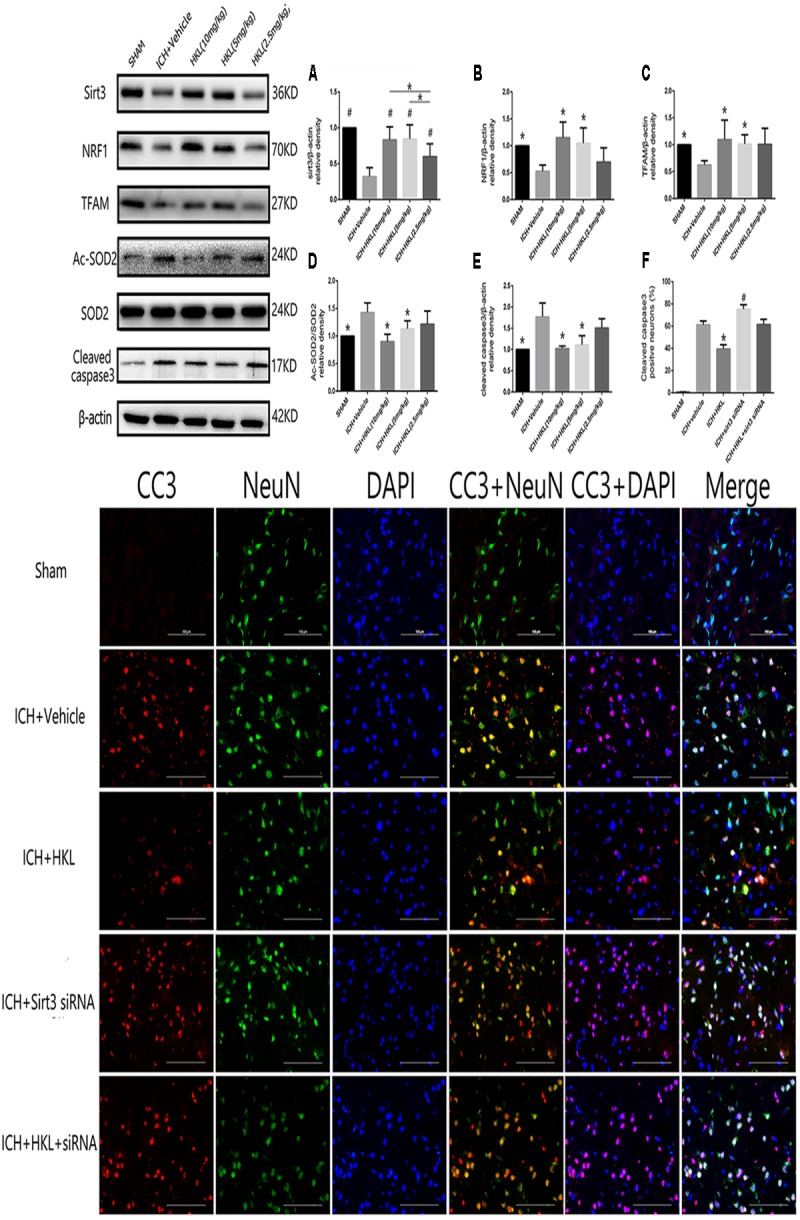
HKL mediated the expression of sirt3 and its downstream signaling molecules after hyperglycemic ICH. (A) Sirt3 protein expression was significantly enhanced by HKL in a dose-dependent manner. #P < 0.05 versus ICH + vehicle group, ∗P < 0.05 (n = 6 in each group). (B) NRF1 expression, ∗P < 0.05 versus ICH + vehicle group (n = 6 in each group). (C) TFAM expression, ∗P < 0.05 versus ICH + vehicle group (n = 6 in each group). (D) Ac-SOD2/SOD2 ratio (Ac-SOD2, acetylated SOD2), ∗P < 0.05 versus ICH + vehicle group (n = 6 in each group). (E) Cleaved caspase3 expression, ∗P < 0.05 versus ICH + vehicle group (n = 6 in each group). (F) Representative co-labeling cleaved-caspase3/NeuN images of ipsilateral basal ganglia. Quantification of cleaved caspase3-positive neurons (% = cleaved caspase3-positive neurons/total neurons), ∗P and #P < 0.05 versus the rest groups (n = 6 in each group). Scale bars: 100 μm.