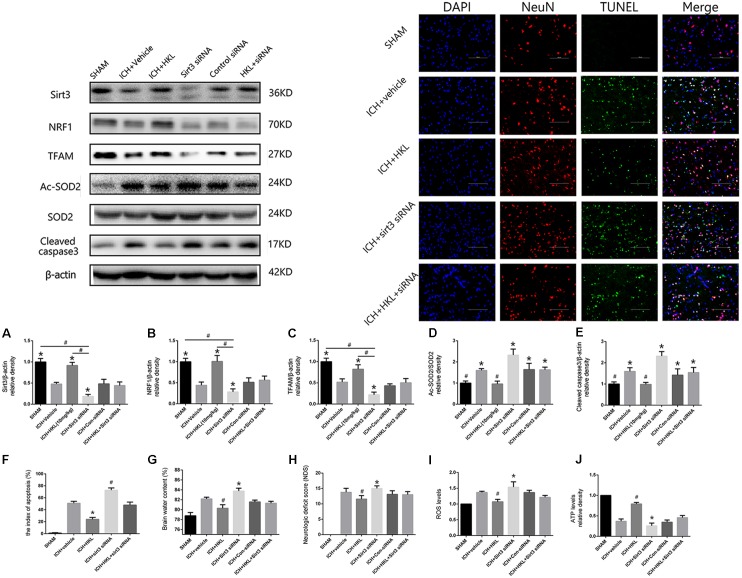
FIGURE 4.
Sirt3 knockdown abolished the positive effects of HKL and exacerbated cerebral injury. (A) Sirt3 expression. (B) NRF1 expression. (C) TFAM expression. ∗P < 0.05 versus the rest three groups, #P < 0.05 (n = 6 in each group). (D) Ac-SOD2/SOD2 ratio. (E) Cleaved caspase3 expression. ∗P < 0.05 versus the rest two groups, #P < 0.05 versus the rest four groups (n = 6 in each group). (F) Representative co-labeling TUNEL/NeuN pictures of ipsilateral basal ganglia. Quantification of TUNEL-positive neurons (the index of apoptosis = TUNEL-positive neurons/total neurons, n = 6 in each group), Scale bars: 100 μm. (G) Brain water content. (H) Neurologic deficit scores. (I) ROS levels. (J) ATP levels ∗P and #P < 0.05 versus the rest groups (n = 6 in each group).

