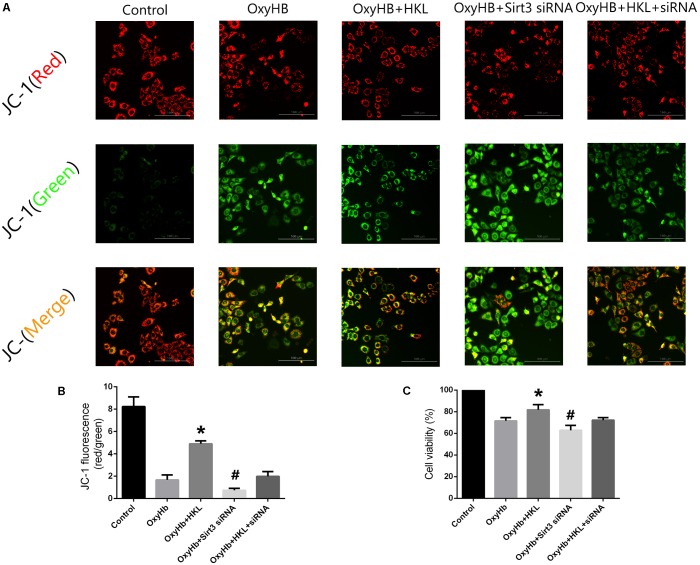
FIGURE 5.
Measurement of Δψm and cell viability in SH-SY5Y cells. (A) Representative JC-1 staining pictures of SH-SY5Y cells. (B) Quantification of JC-1 fluorescence intensity (red/green florescent area), Scale bars: 100 μm. (C) Cell viability. ∗P and #P < 0.05 versus the rest groups (n = 6 in each group).

