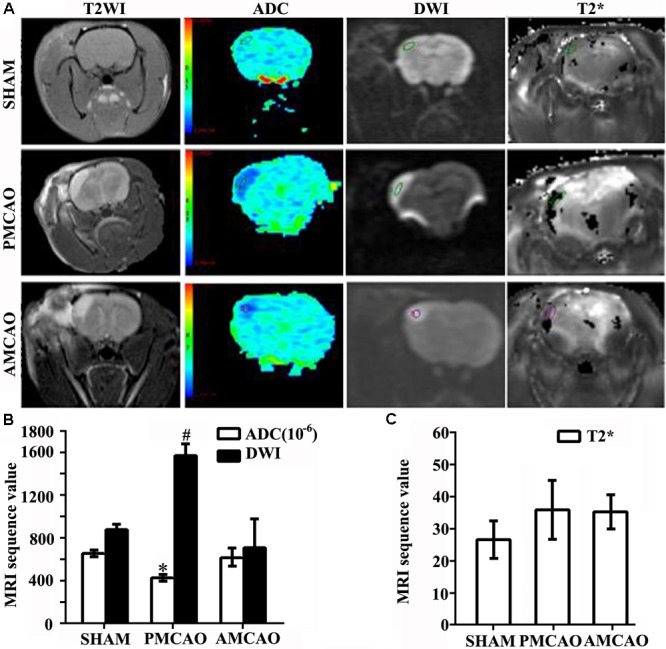
FIGURE 1.

Infarct volumes. (A) MRI images showing changes in the ischemia area. Areas in pale blue in the ADC images represent the signal of the free diffusion of extracellular free water molecules; areas in dark blue reflect the limited diffusion of extracellular free water molecules. (B) Histogram showing changes in the values of the ADC and DWI in all groups. Quantitative analysis demonstrating the ADC values in the PMCAO group vs. the SHAM group (∗p < 0.05), the AMCAO group vs. the PMCAO group (∗p < 0.05), and the DWI values in the SHAM and AMCAO groups vs. the PMCAO group (#p < 0.01). Mean ± SEM, N = 5. (C) Histogram showing changes in the values of T2∗ in all groups. Mean ± SEM, N = 5.
