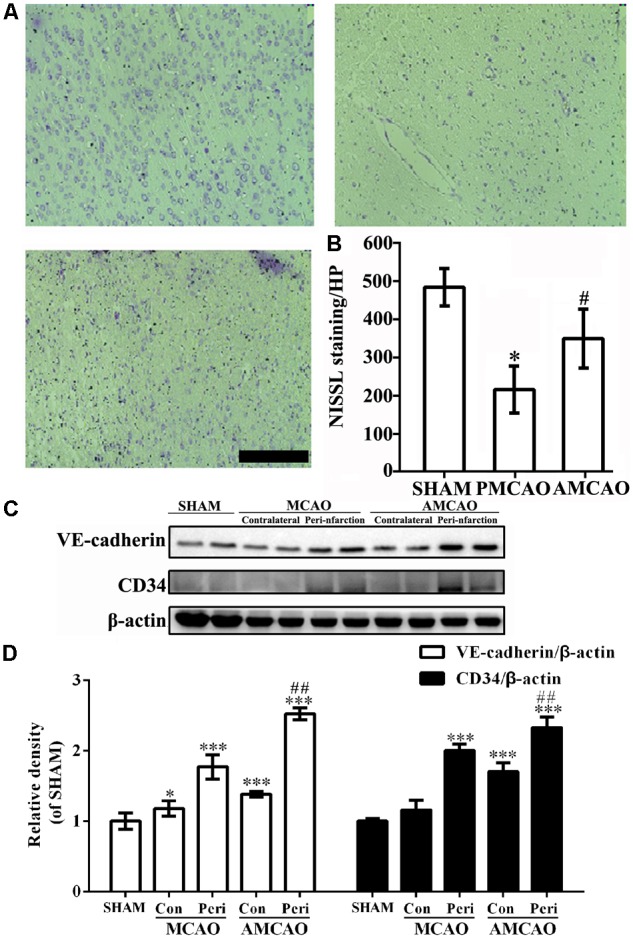
FIGURE 2.

The changes in neurons and endothelial cells surrounding the infarct areas. (A) The number of surviving neurons shown by Nissl staining. Scale bar = 200 μm. (B) Quantitative analysis revealing the number of surviving neurons in the vehicle PMCAO group vs. the SHAM controls (#p < 0.01) and the AMCAO group vs. the vehicle PMCAO group (∗p < 0.05). Mean ± SEM, N = 5. (C) The protein bands of CD34, VE-cadherin and β-actin detected by Western blotting. SHAM indicates samples from the sham-operated group, contralateral indicates the samples from the contralateral tissue, and peri-infarction indicates the samples from the peri-infarct tissue of the infarct ipsilateral areas. (D) The relative density of CD34/β-actin and VE-cadherin/β-actin in the PMCAO group assessed in comparison with the SHAM group (∗p < 0.05, ∗∗∗p < 0.001) and the AMCAO group (Con, the contralateral tissue; Peri, the peri-infarct tissue of the infarct ipsilateral areas) vs. the PMCAO group (Peri), ##p < 0.01. Mean ± SEM was calculated by one-way analysis of variance (ANOVA) followed by the least significant difference (LSD) post hoc test (homogeneity of variance was determined), N = 3.
