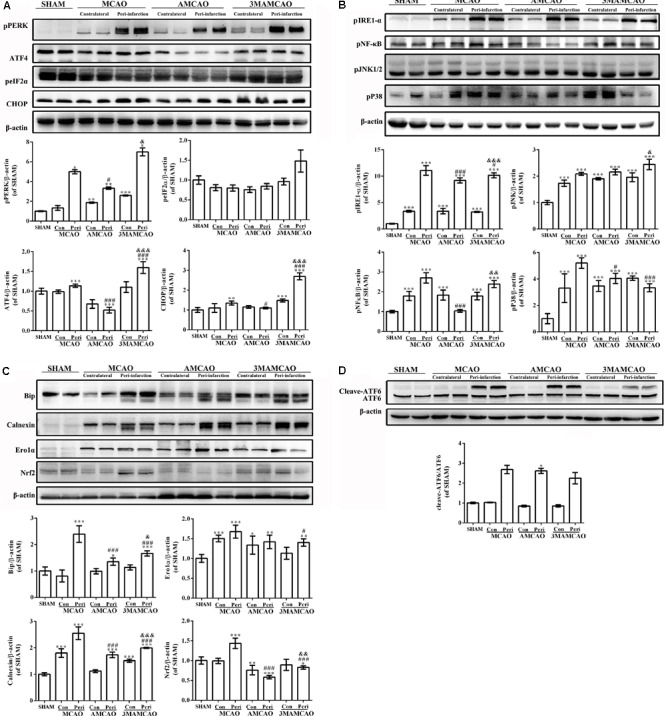
FIGURE 6.

Regulation of protein expression in the ER stress pathway by ATV and 3MA in ischemic stroke rats. (A) The protein bands of pPERK, peIF2α, ATF4, CHOP, and β-actin detected by Western blotting and exposed by Tanon 2500/2500R. (B) The protein bands of ATF6 and β-actin detected by Western blotting and exposed by Tanon 2500/2500R. (C) The protein bands of pIRE-1α, pNF-κB, pP38, and pJNK detected using Western blotting and exposed by Tanon 2500/2500R. (D) The protein bands of Bip, calnexin, Ero1-Lα and Nrf2 detected using Western blotting and exposed by Tanon 2500/2500R. The relative densities of the other proteins were assessed by the ratio of each ER stress protein to β-actin in comparison with the SHAM group (∗p < 0.05, ∗∗p < 0.01, ∗∗∗p < 0.001), the AMCAO group vs. the PMCAO group (#p < 0.05, ###p < 0.001) and the AMCAO group vs. the 3MAMCAO group (&p < 0.05, &&p < 0.01, &&&p < 0.001). The mean ± SEM of pPERK/β-actin, peIF2α/β-actin, and cleaved-ATF6/ATF6 was calculated by one-way analysis of variance (ANOVA) followed by the Tamhane’s T2 test (homogeneity of variance was not determined), whereas the mean ± SEM of ATF4/β-actin, CHOP/β-actin, pIRE-1α/β-actin, pNF-κB/β-actin, pP38/β-actin, pJNK/β-actin, Bip/β-actin, calnexin/β-actin, Ero1-Lα/β-actin, and Nrf2/β-actin was calculated by one-way ANOVA followed by the least significant difference (LSD) post hoc test (homogeneity of variance was determined), N = 3.
