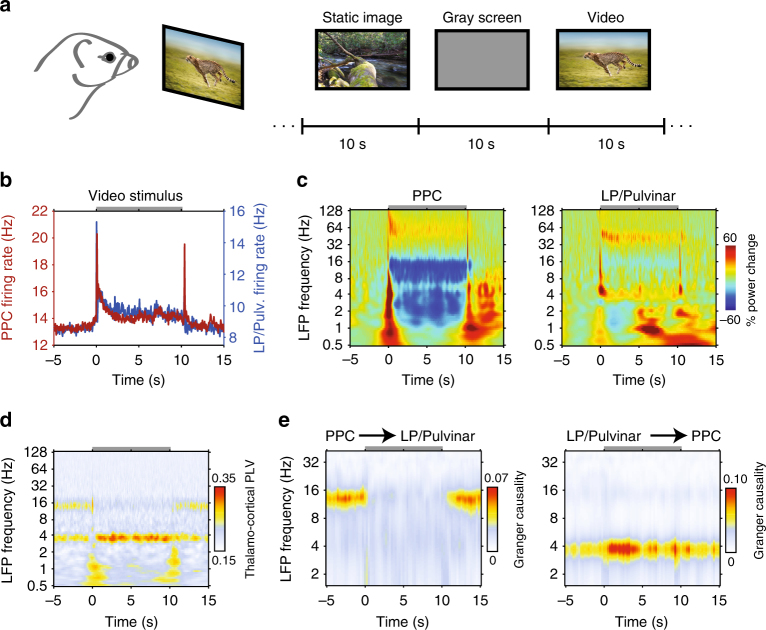
Fig. 5.
Visual processing induced changes in thalamo-cortical network dynamics. a Animals passively viewed a collection of naturalistic images or videos. During the interstimulus interval a gray screen was presented. The image “Running Cheetah” by Freder is licensed under the Standard iStock Photo License (Getty Images). b Population mean spike rate in PPC and LP/Pulvinar during presentation of video stimuli. The gray bar at the top of the plot indicates the duration of stimulation. c Population LFP spectrograms from PPC (left) and LP/Pulvinar (right) during presentation of naturalistic videos. LFP power was normalized to the period −5 to −1 s before stimulus onset. Note the decrease in alpha oscillatory power in PPC during stimulus presentation. d Across-session average thalamo-cortical phase synchronization in response to naturalistic video stimuli. PLV in the theta band is elevated during stimulus presentation, while alpha PLV is weaker. e Time and frequency resolved Granger causality analysis computed between PPC and LP/Pulvinar LFP signals for naturalistic video stimuli. The onset of video stimuli leads to a breakdown of PPC causal influence on LP/Pulvinar in the alpha band (left plot), and an increase of LP/Pulvinar causal influence on PPC in the theta frequency band (right plot)

